🔎 Python 3.15 introduces profiling.sampling, a profiler that periodically samples the call stack to reveal where a program spends its time. Unlike tracing profilers, it does not add an instruction to every function call: it observes the process from outside with little impact on execution.
The author shows how to use it with scripts and running processes, and how to distinguish CPU time, I/O waits, and activity related to the GIL. Results can be viewed as flame graphs, line-level heatmaps, or terminal reports.
Sampling provides a statistical estimate, not an exact record: it can miss very short functions and does not count every call. In exchange, it is useful for finding the biggest resource consumers, even in production services.
💡 Explanation in a nutshell#
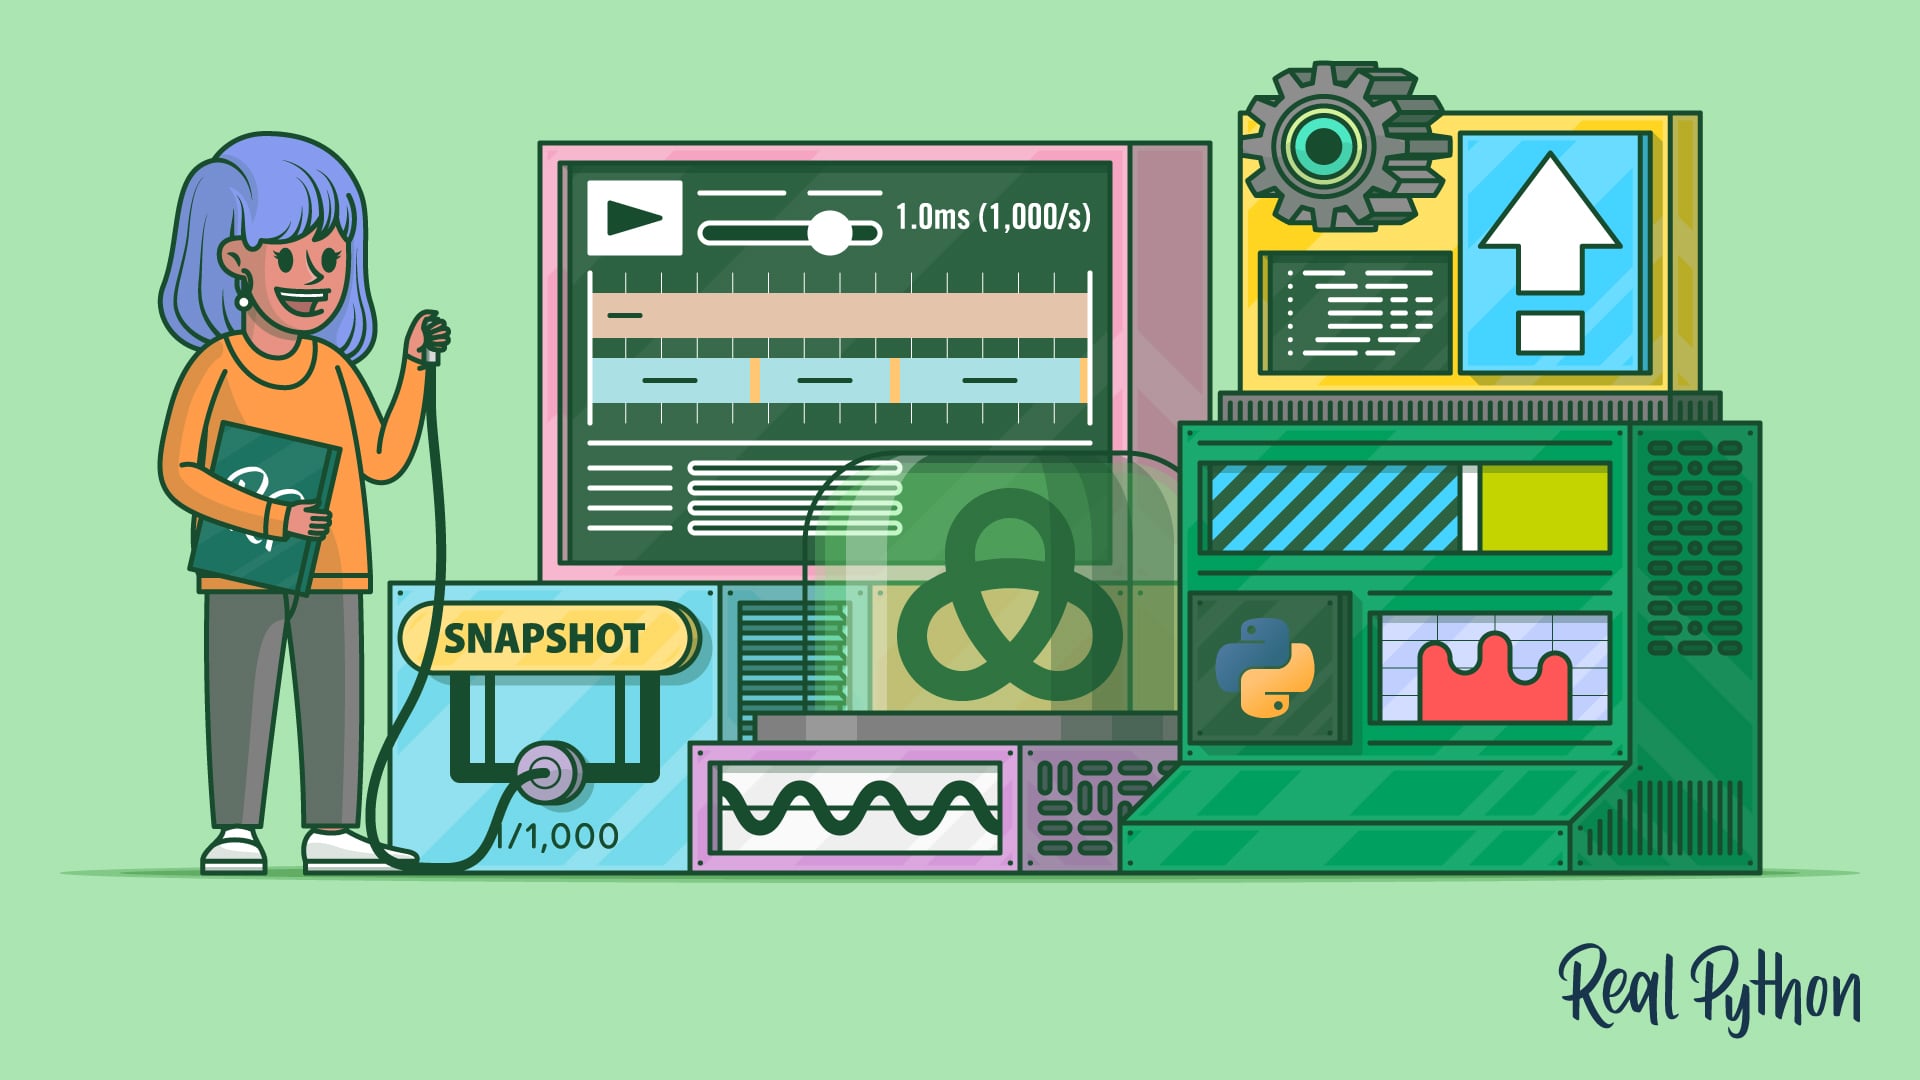
Instead of checking every movement, imagine taking quick snapshots of a program while it runs. Functions that appear most often probably use the most time. It is a less intrusive way to find where optimization might help.
More information at the link 👇