📈 SplineTransformer: When a Straight Line Isn’t Enough#
Linear regression is great… until your data has curves. And high-degree polynomial regression goes wild at the edges. Splines are the perfect middle ground.
🔍 The Problem with Polynomials#
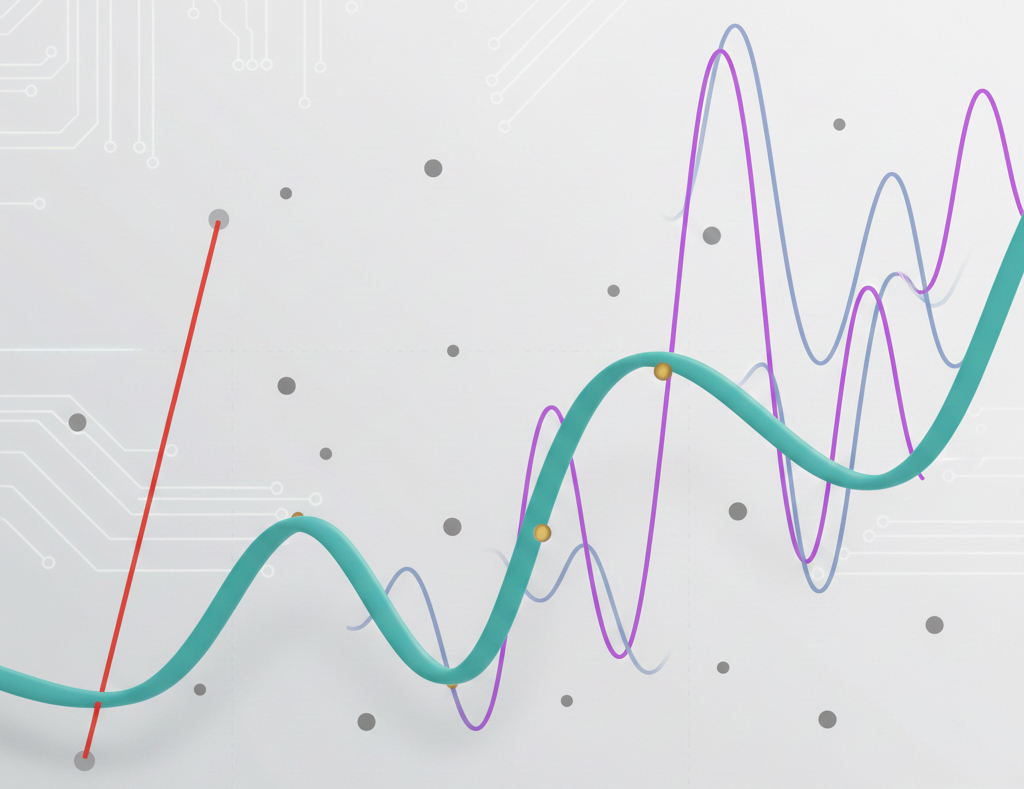
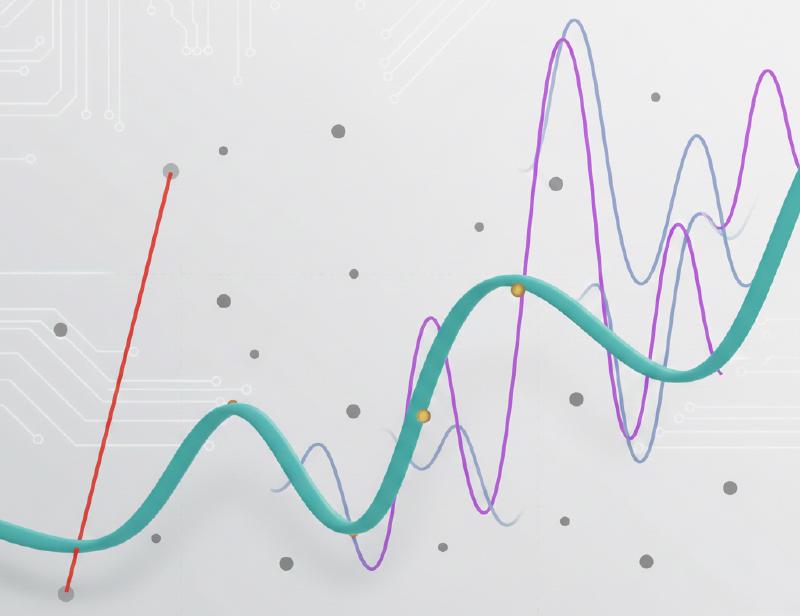
Runge’s Phenomenon: high-degree polynomials “blow up” at the edges of the dataset. One weird data point at one end can ruin the entire curve.
✂️ What Are Splines?#
Instead of fitting one complex equation to all the data, splines divide it into segments at points called knots. Each segment gets its own simple polynomial, all stitched together seamlessly.
Key advantages:
- 🎯 Local control – what happens in one segment stays there
- 🧵 Guaranteed smoothness – joints are perfectly continuous
- 🏗️ Stability – no wild behavior at the boundaries
🐍 Python Implementation#
from sklearn.preprocessing import SplineTransformer
from sklearn.linear_model import Ridge
from sklearn.pipeline import make_pipeline

model = make_pipeline(
    SplineTransformer(n_knots=8, degree=3, extrapolation='constant'),
    Ridge(alpha=0.1)
)
model.fit(X, y)
🎛️ Key Parameters#
| Parameter | Use |
|---|---|
n_knots | Number of knots (more = more flexible) |
degree | Smoothness: 1=linear, 3=cubic (default) |
extrapolation='periodic' | For cyclic data (hour of day, month) |
knots='quantile' | If data is clustered |
💡 In Simple Terms#
Imagine you need to draw a smooth curve through many points. Instead of using one big bendy ruler that curves too much, you use many small rulers joined at the ends. That’s splines: smooth, precise, and drama-free at the edges.
More information at the link 👇