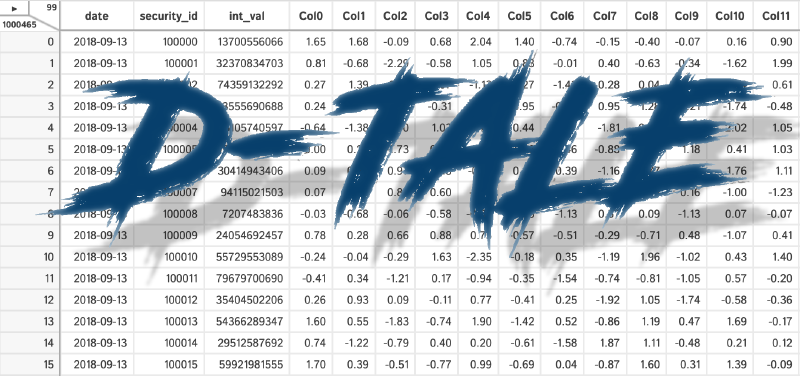
📊 D-Tale: explore your DataFrames like Excel (but better)
Exploring data in pandas often requires a lot of code and multiple tools. D-Tale 🧠📈 gives you an interactive graphical interface to analyze DataFrames directly from your browser.
✨ What makes it interesting?
- 🌐 Opens a web app to filter, sort, and explore data without writing more code.
- 📉 Built-in charts: histograms, correlations, and custom visualizations.
- 🧹 Cleaning tools, outlier detection, and creating new columns from the UI.
- 🧾 Even allows exporting the code for what you did.
👶 For beginners:
It’s like giving pandas visual superpowers: you can see, understand, and play with the data before you code.
Ideal for quick exploration and exploratory data analysis 🚀
More information at the link 👇
Also published on LinkedIn.