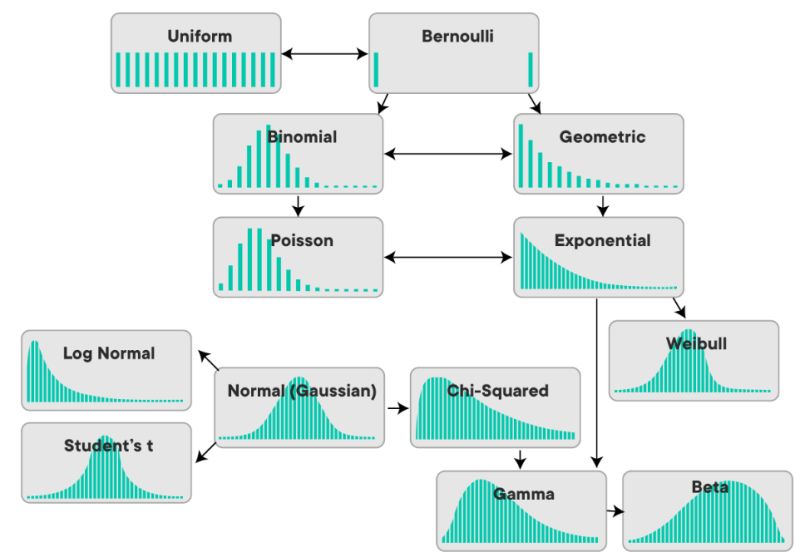
🎯 Probability Distributions: the quiet foundation of Machine Learning
In machine learning, every model assumes a shape for how your data behaves. Knowing probability distributions lets you validate those assumptions and avoid misinterpretation.
🔵 Normal Distribution (Gaussian)
- The famous “bell.”
- 📌 Values concentrated around the mean
- 📌 Symmetric
- 📌 Present in natural phenomena (height, measurement errors)
- 👉 Imagine most of your data is “in the middle” and few observations at the extremes.
🟢 Binomial Distribution
- Models how many times a “success” occurs in repeated trials.
- 📌 Examples: ad clicks, A/B test outcomes
- 👉 It’s like flipping a coin many times and counting how often it lands heads.
🟠 Poisson Distribution
- Counts how many events occur in an interval.
- 📌 Tickets per day, errors per hour, rare events
- 👉 Imagine counting how often something happens in a period when it occurs at an average rate.
💡 Understanding these distributions helps you choose better models, validate assumptions, and make more confident data-driven decisions.
More information at the link 👇
More in the following external reference.
Also published on LinkedIn.