📊 What is time series decomposition and why should you know it if you work with data?
Time series are everywhere: monthly sales, energy consumption, market quotes, web traffic…
When we analyze a time series, often it’s not enough to look at raw values. We need to understand its internal structure.
That’s where time series decomposition comes in.
🔍 What is it?
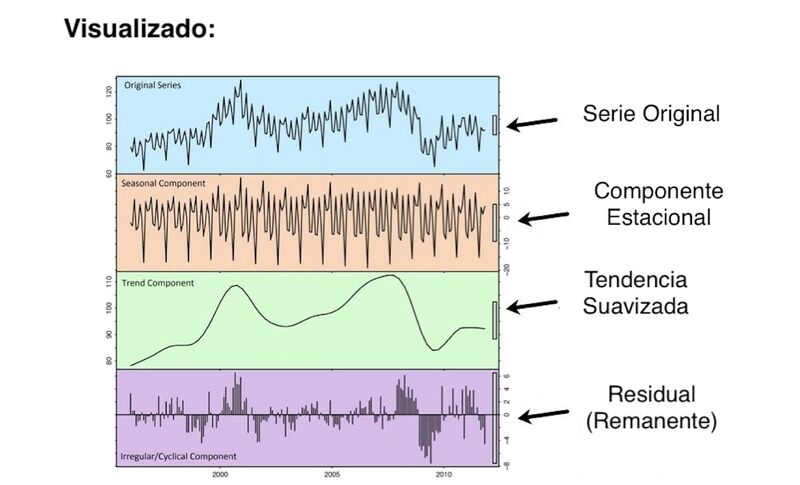
Decomposition separates a series into three key components:
- Trend: the general long-term direction.
- Seasonality: regular cyclic patterns (for example, yearly or monthly seasonality).
- Noise (residual): what cannot be explained by the other two.
🧪 How to do it with Python? With just a few lines of code using statsmodels:
 import pandas as pd
 from statsmodels.tsa.seasonal import seasonal_decompose
 import matplotlib.pyplot as plt

 # Load your time series
 df = pd.read_csv("sales.csv", parse_dates=["date"], index_col="date")
 series = df["sales"]

 # Decompose
 decomposition = seasonal_decompose(series, model='additive', period=12)

 # Visualize
 decomposition.plot()
 plt.show()
🧠 This technique lets you answer questions like:
- Are we growing despite seasonal fluctuations?
- What part of the variability is predictable?
- When is a value truly an “anomaly”?
💡 Ideal for improving forecasting models, better understanding your business, or detecting unusual behavior.
Also published on LinkedIn.